Visualizing REST API calls with Lambda and DynamoDB
Let's draw some pictures

When I'm learning something new, I often create visualization diagrams to ensure I fully grasp the material. These diagrams end up being a handy reference for refreshing on the subjects. I’ve shown these to others previously and they end up being useful, albeit a bit overwhelming at first considering the amount of detail that may end up in a diagram.
Today, I’ll walk through how I created one the diagrams I reference most often - REST API calls with Lambda and DynamoDB on AWS. This entire article visualizes this AWS tutorial.
I’ll be going along step by step and adding in components based on every step in the process.
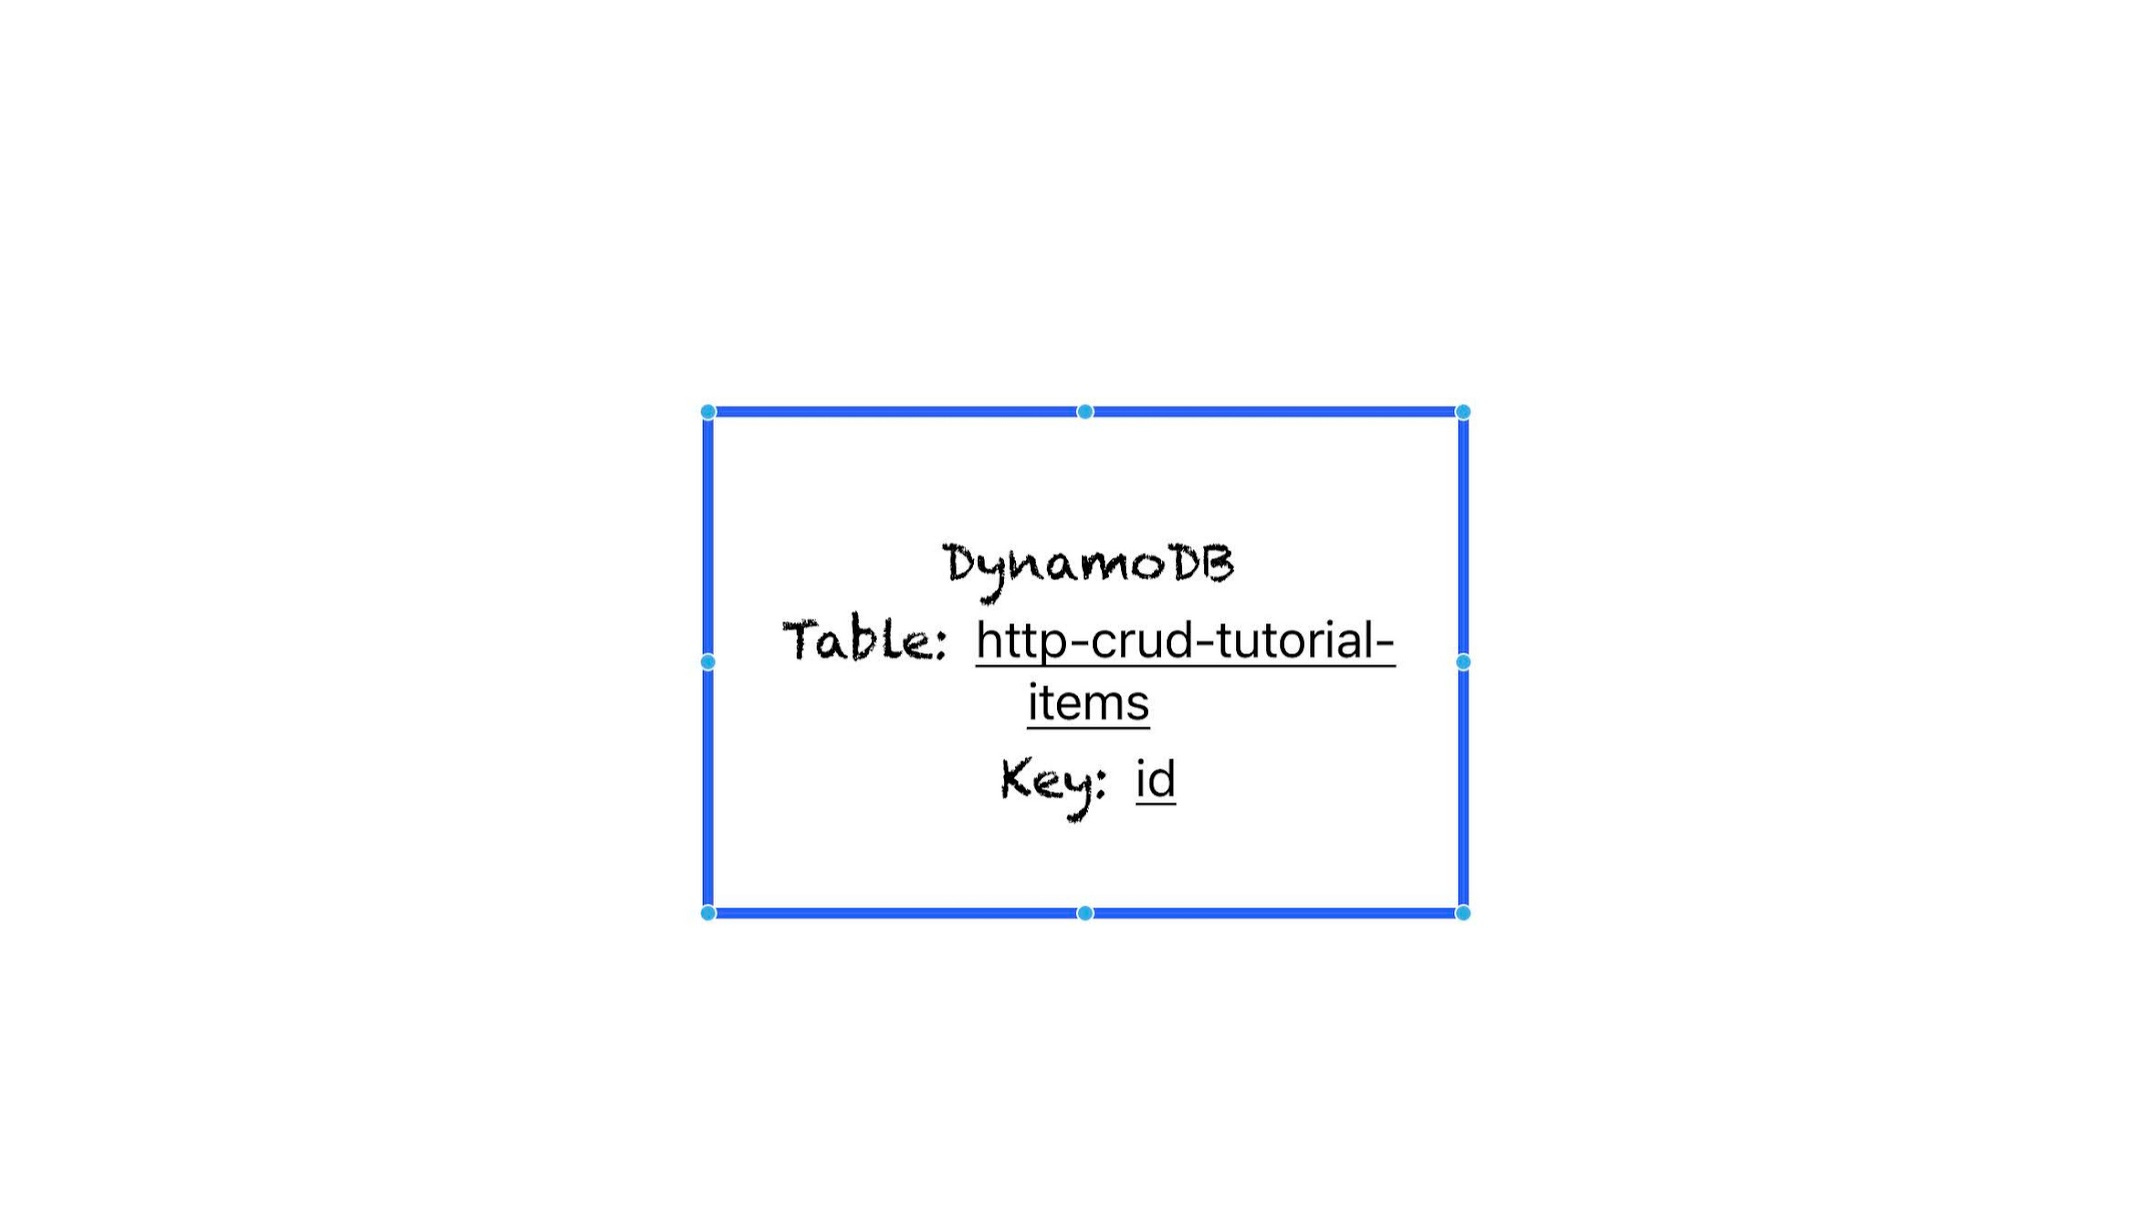
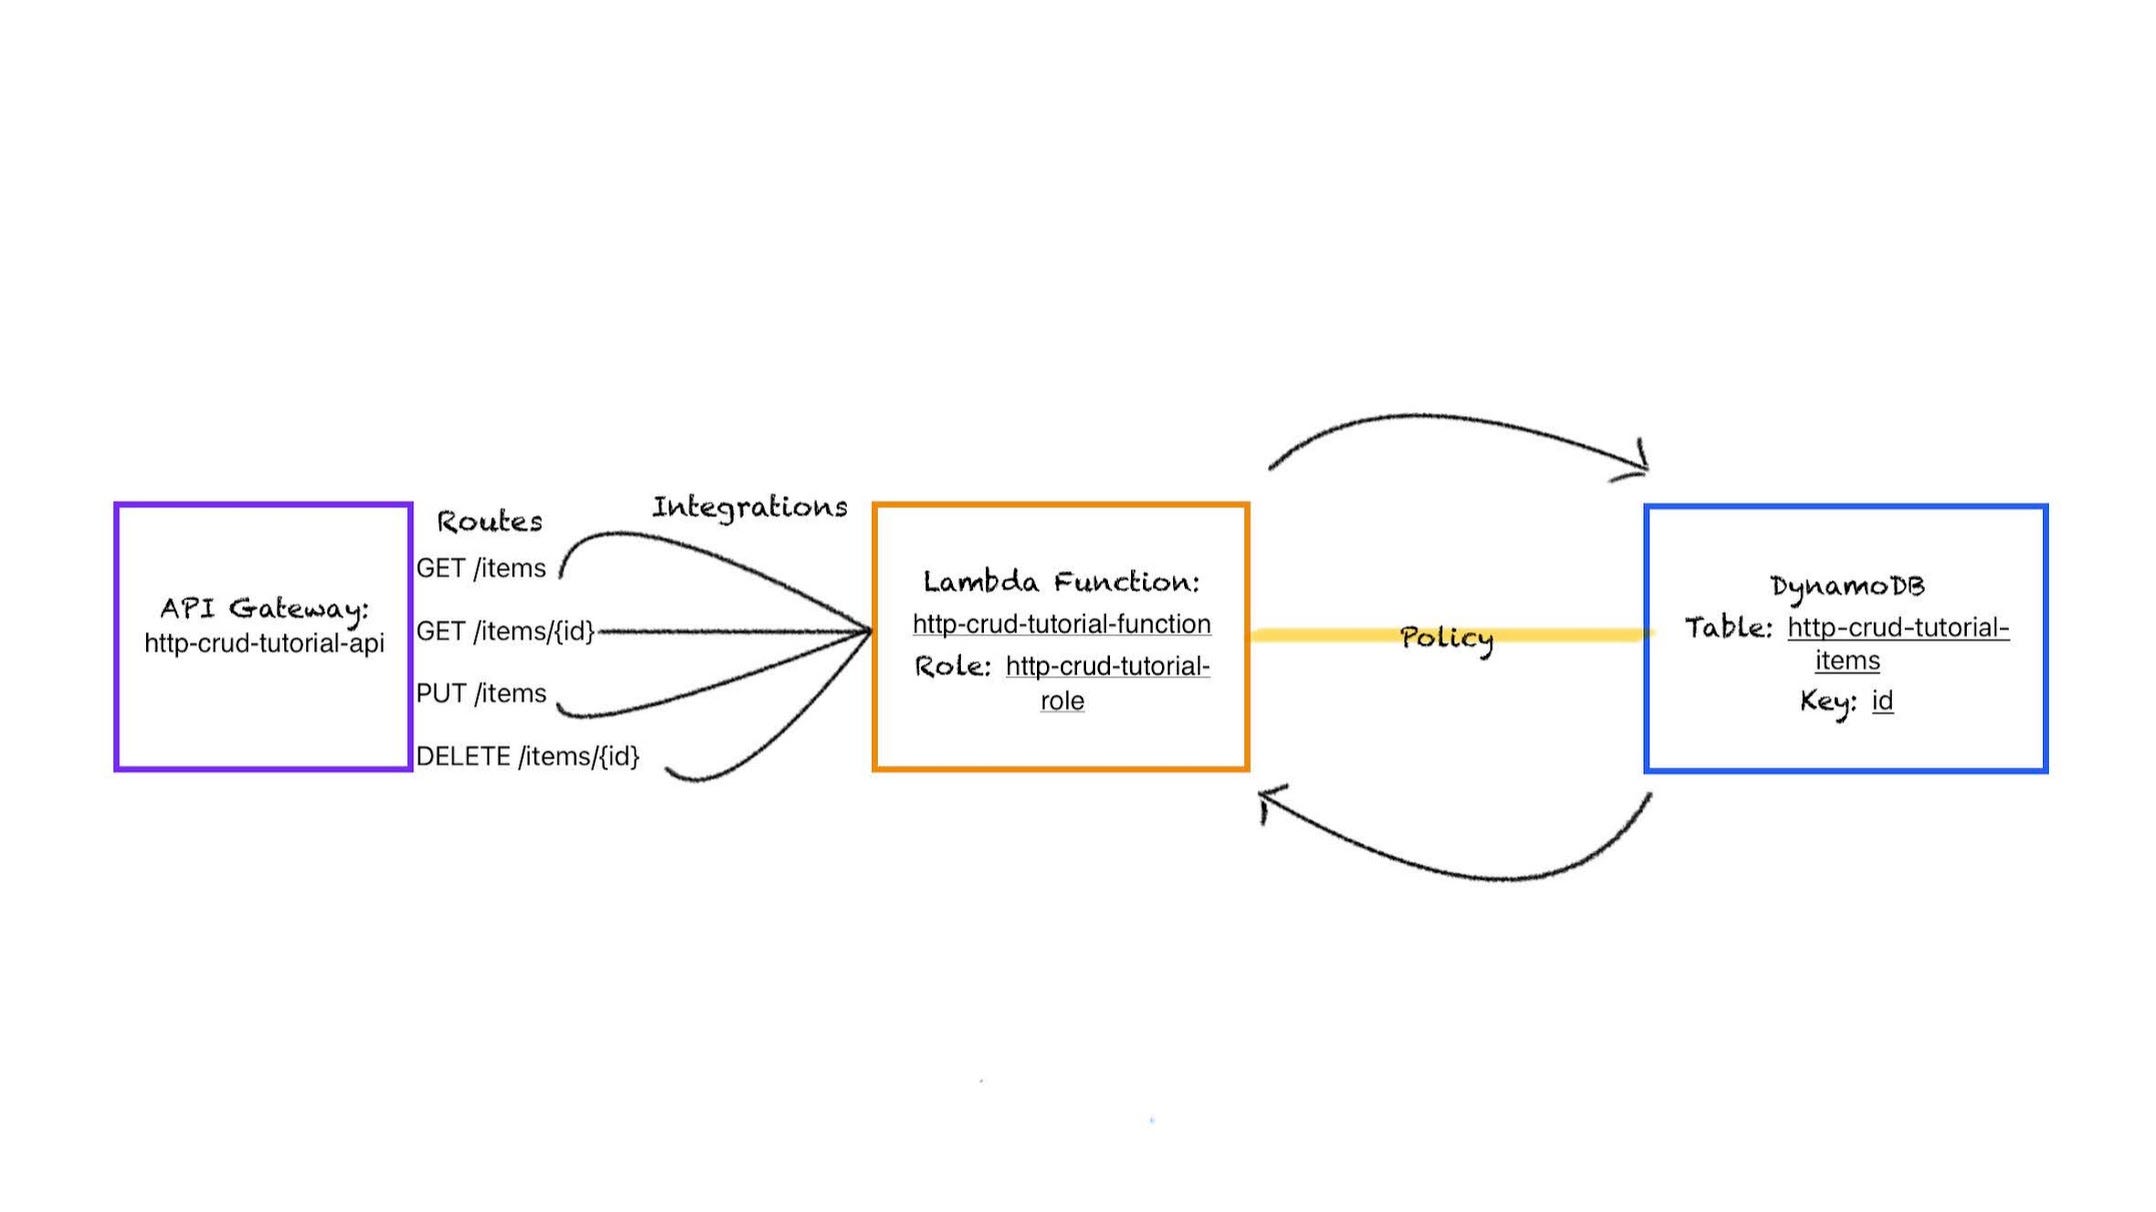
Step 1: Create a DynamoDB database. with the name http-crud-tutorial-items. Its primary key is labeled 'id,' which means that every entry in this database must include an 'id' value.
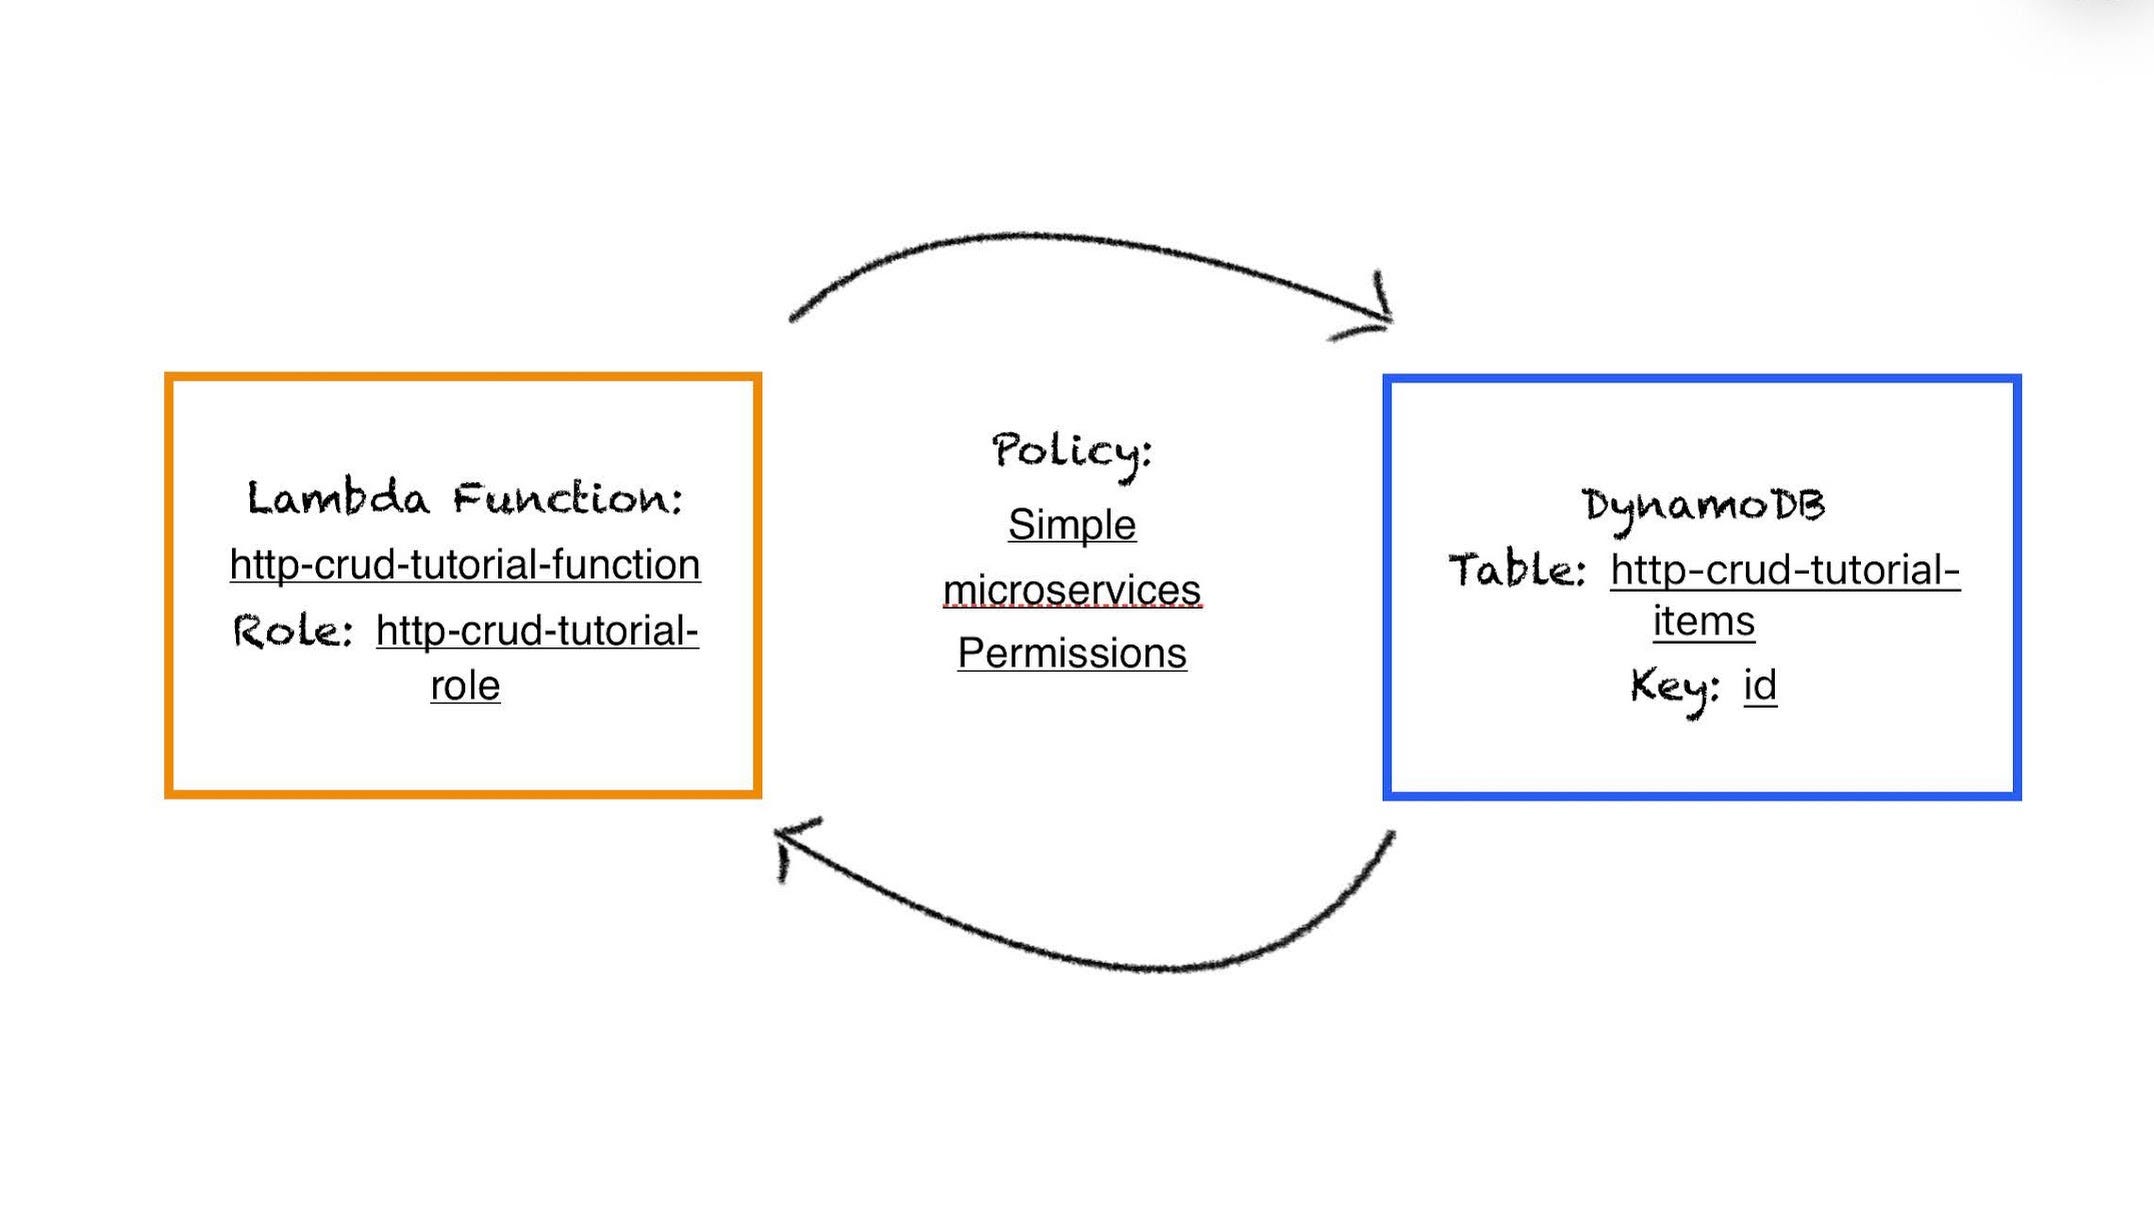
Step 2: Create a Lambda function named http-crud-tutorial-function and set the policy to allow interactions with the DynamoDB instance.
The role http-crud-tutorial-role needs to be assigned a policy, so I set it to Simple Microservices Policy. This is a critical step because policies are how different cloud components are authorized to connect.
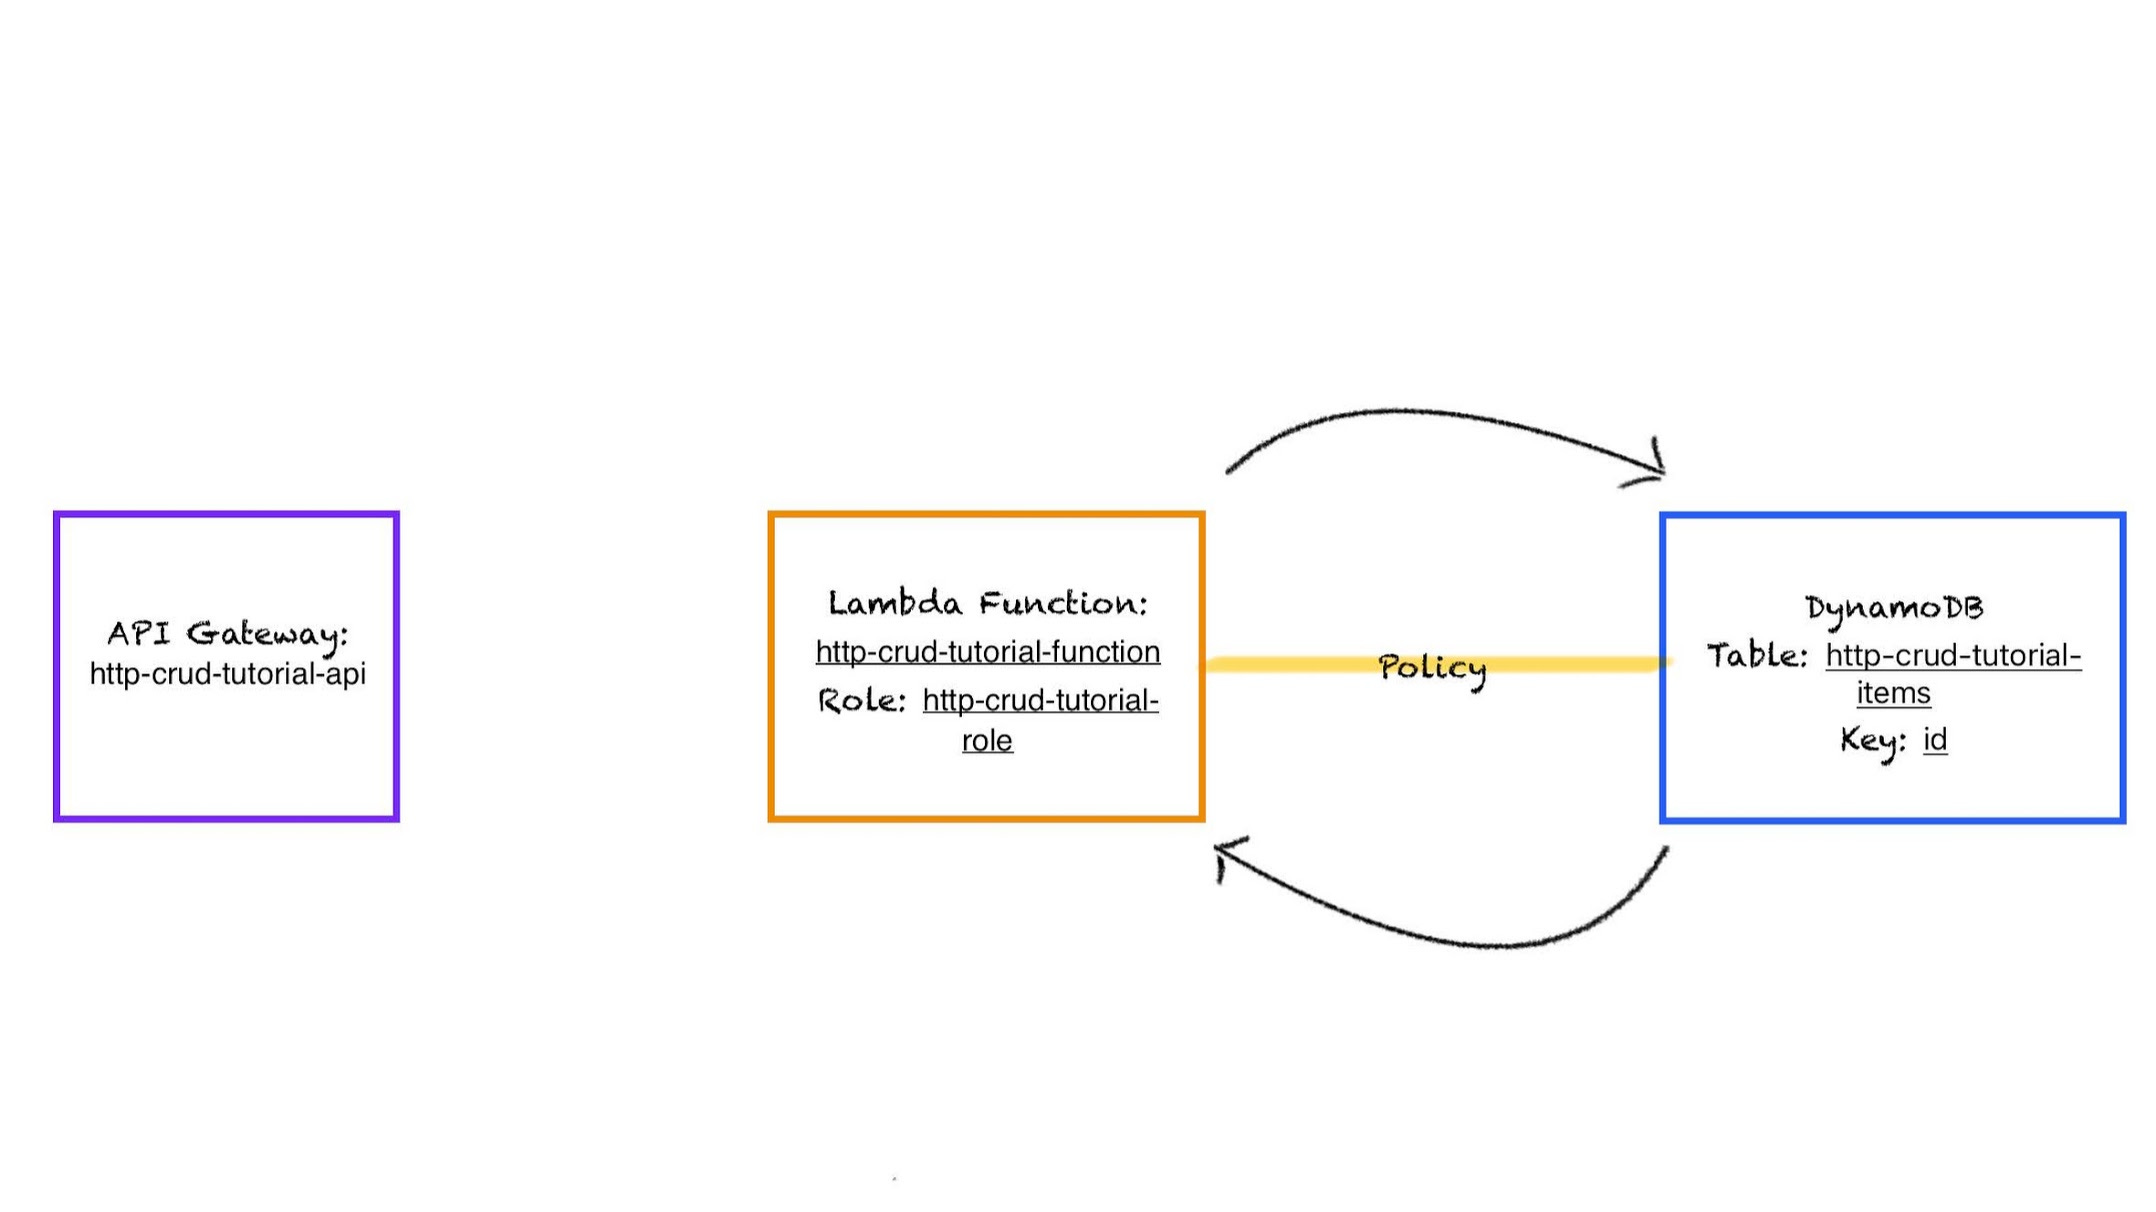
Step 3: Create an API Gateway with the name http-crud-tutorial-api. Intentionally, no connections are made to the Lambda function yet.
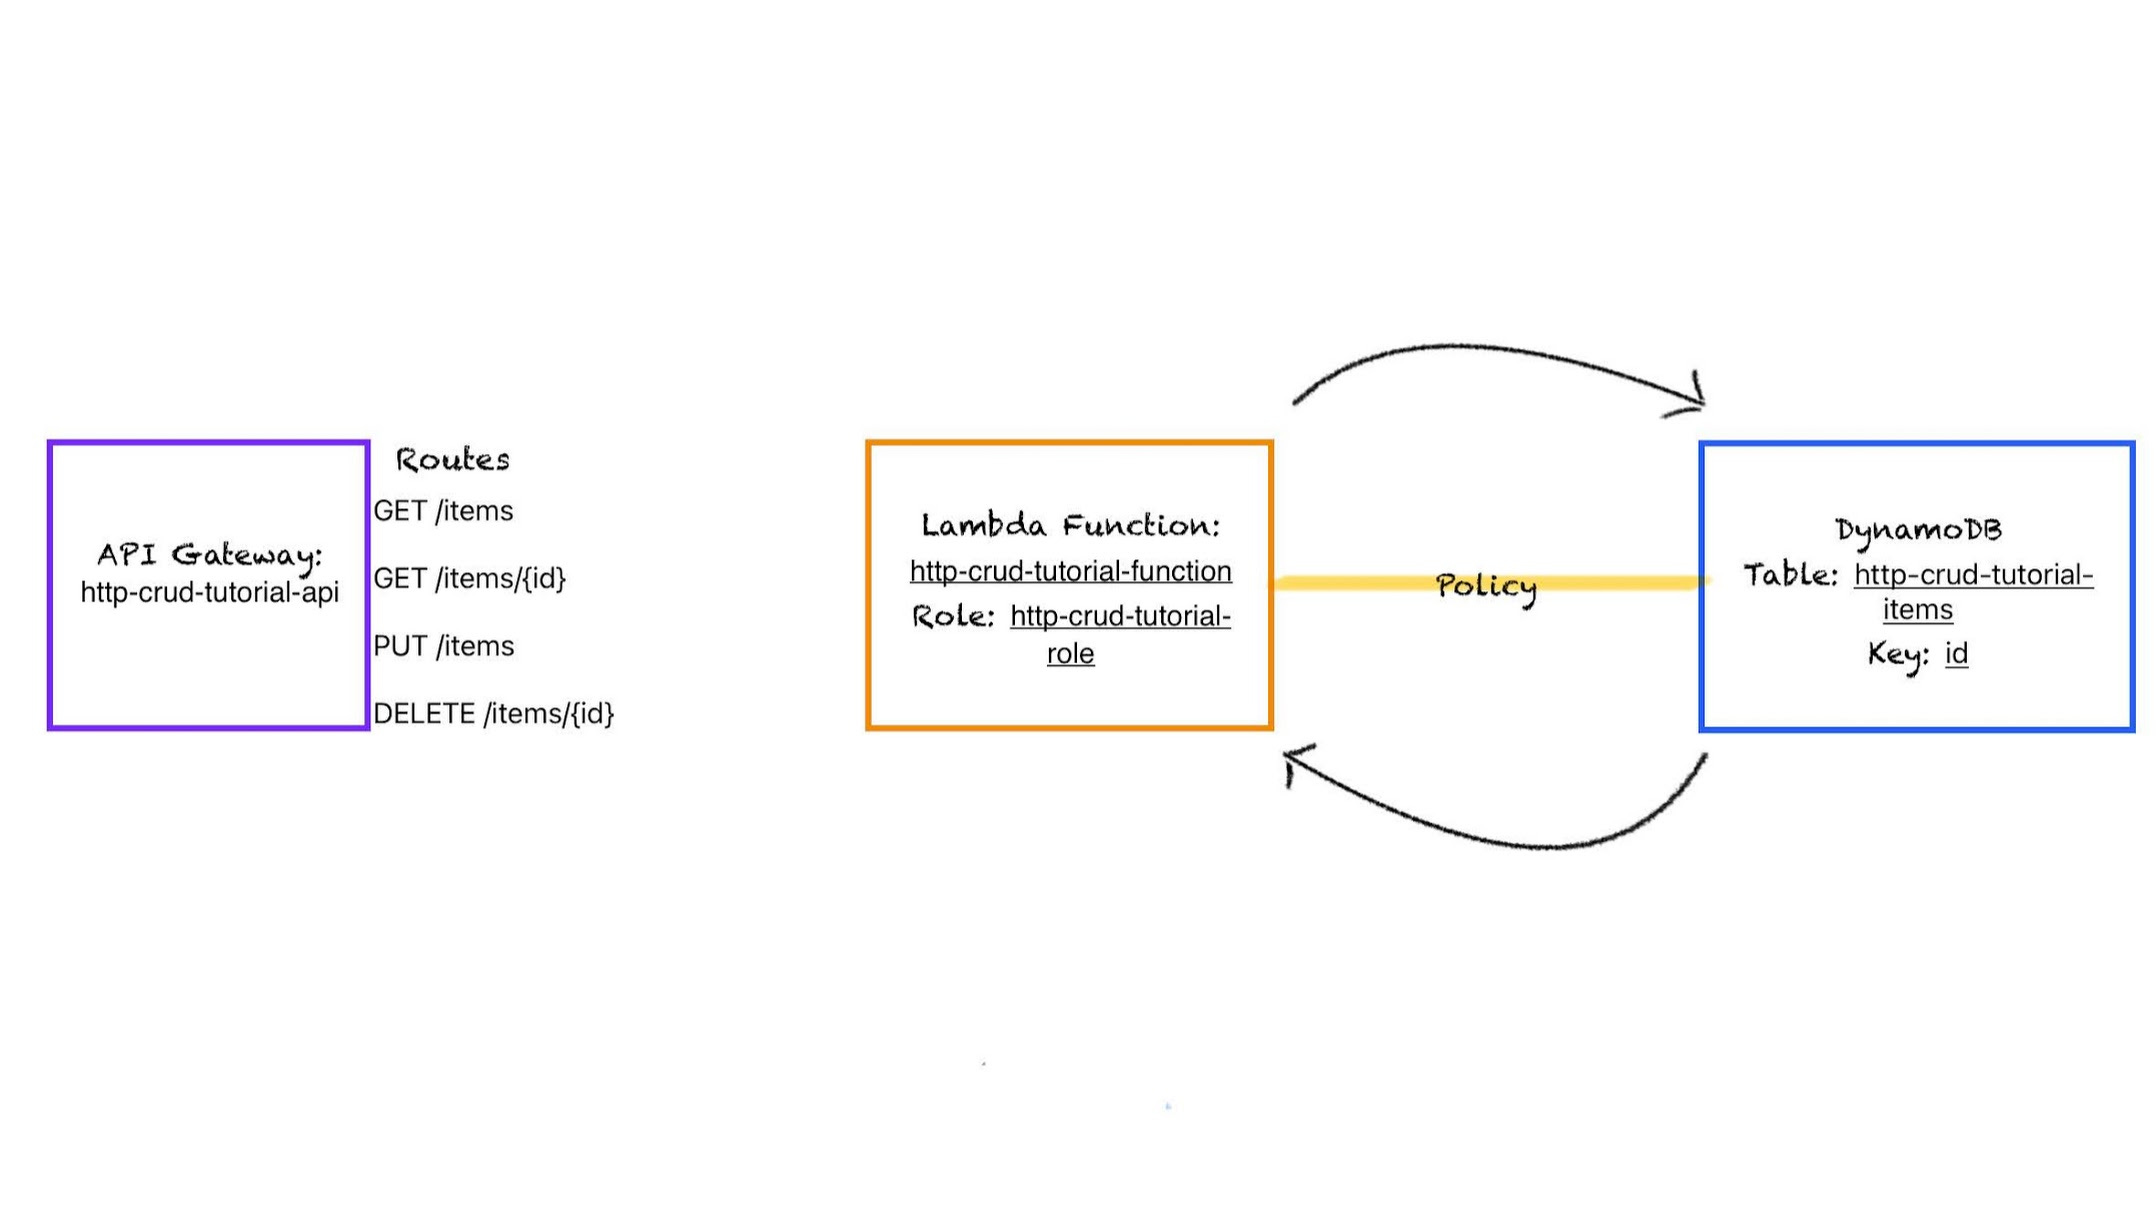
Step 4: Create the associated routes for functionality. Only four routes are created to keep things simple. These will be used to: fetch all the items, fetch a specific item, create an item, and delete an item. In reality, many more routes would be created for this purpose.
Steps 5 & 6: Create an integration between the API Gateway and the Lambda function and set each route to point to the Lambda function. Probably a better practice overall would be to handle have separate Lambda functions dedicated for each route. This isn’t a big deal as it is now, since there are only four routes and that complexity can be managed in a single function.
Step 7: Test your API through the associated URL. Let’s just add in a client to this diagram.
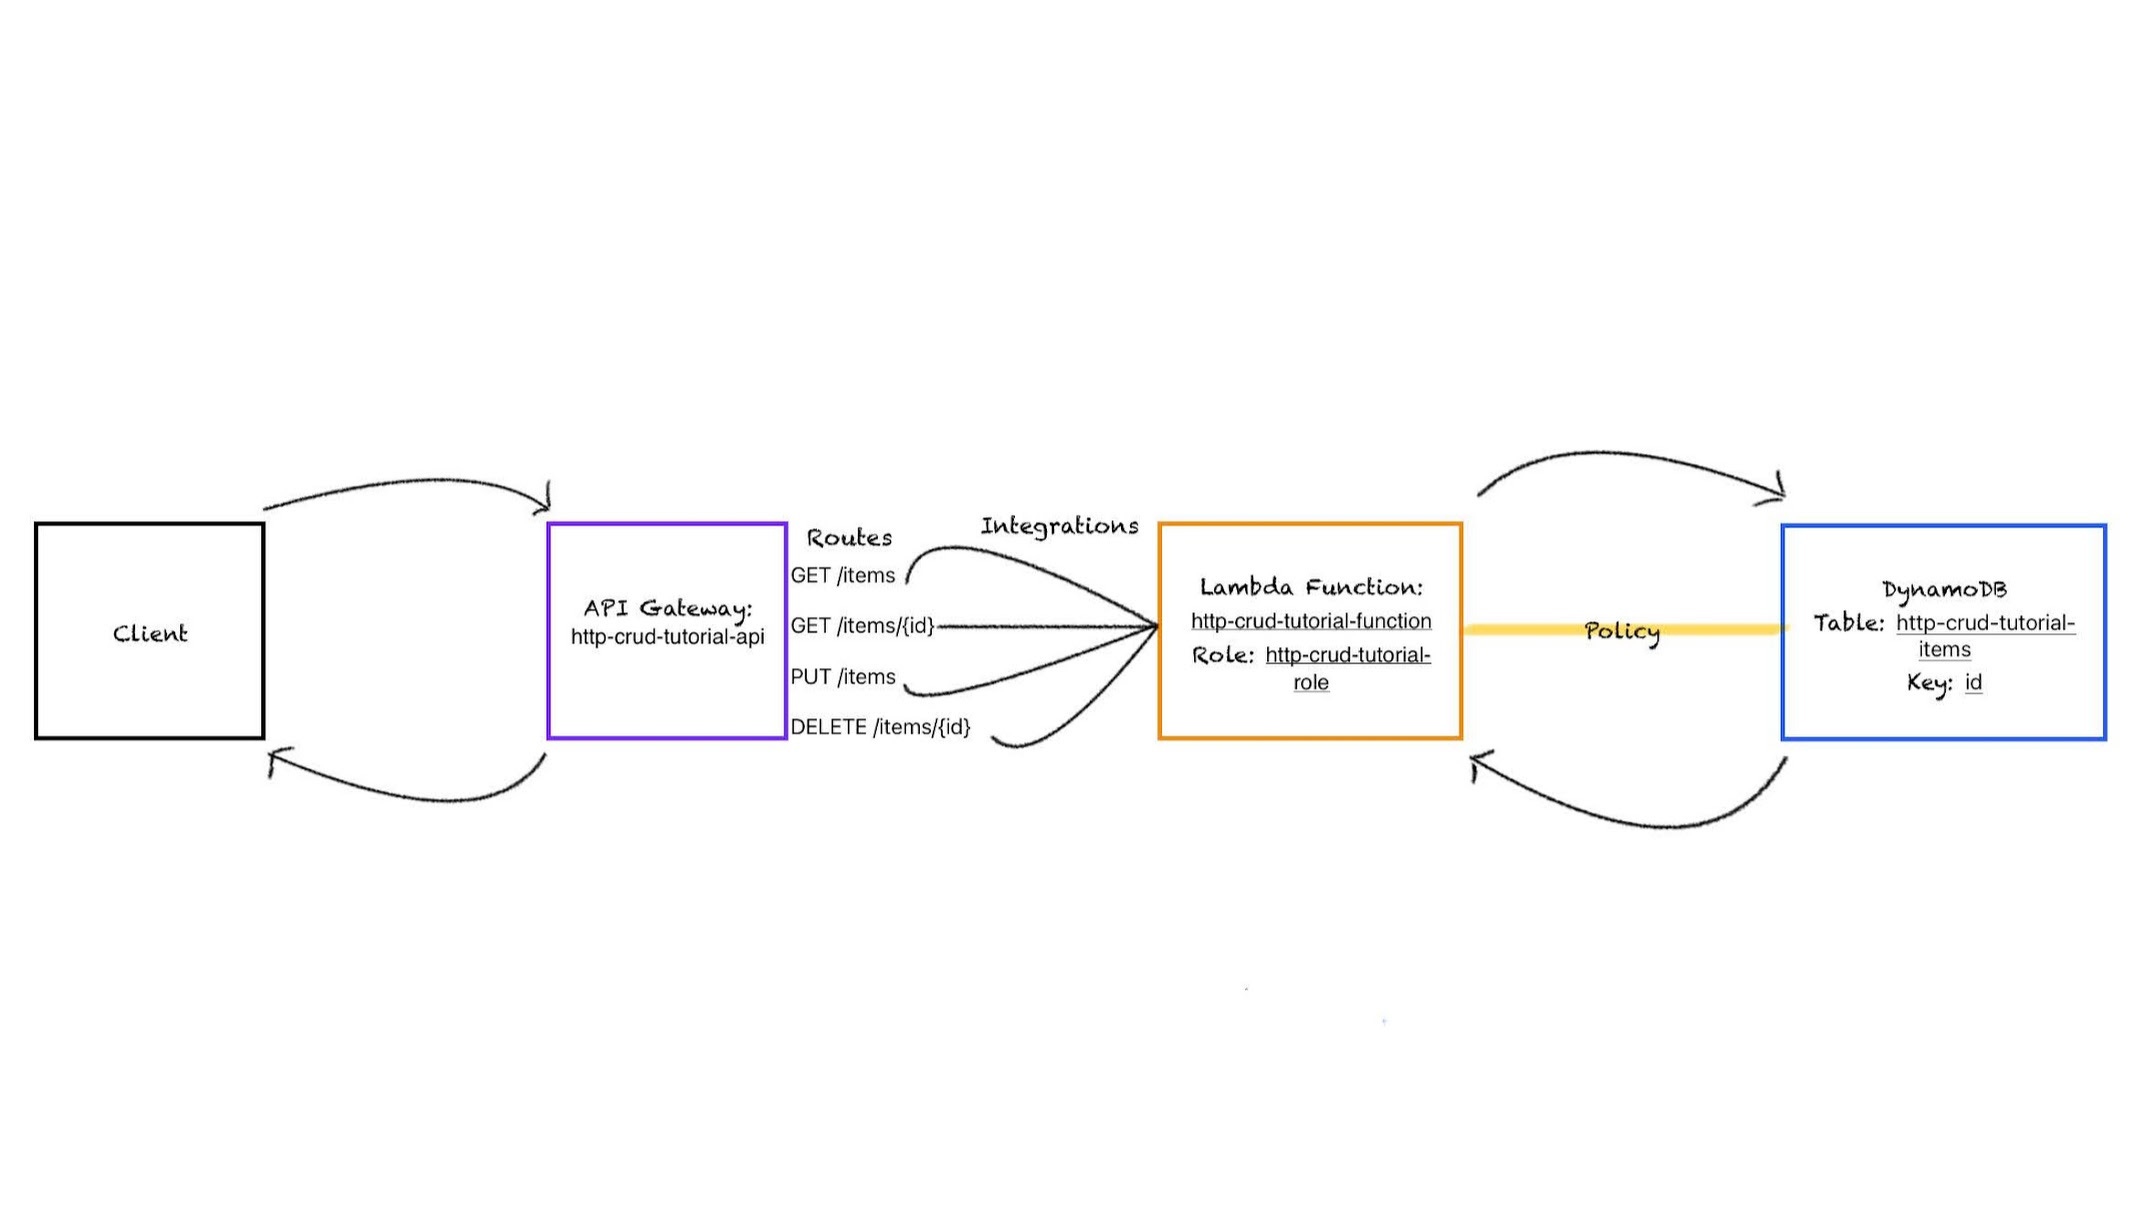
And I think this is a decent picture right now - but I like to add in a little more. I always like to add in code references in my preferred language. Seeing code - and how it fits into the larger picture, always helps some things click for me.
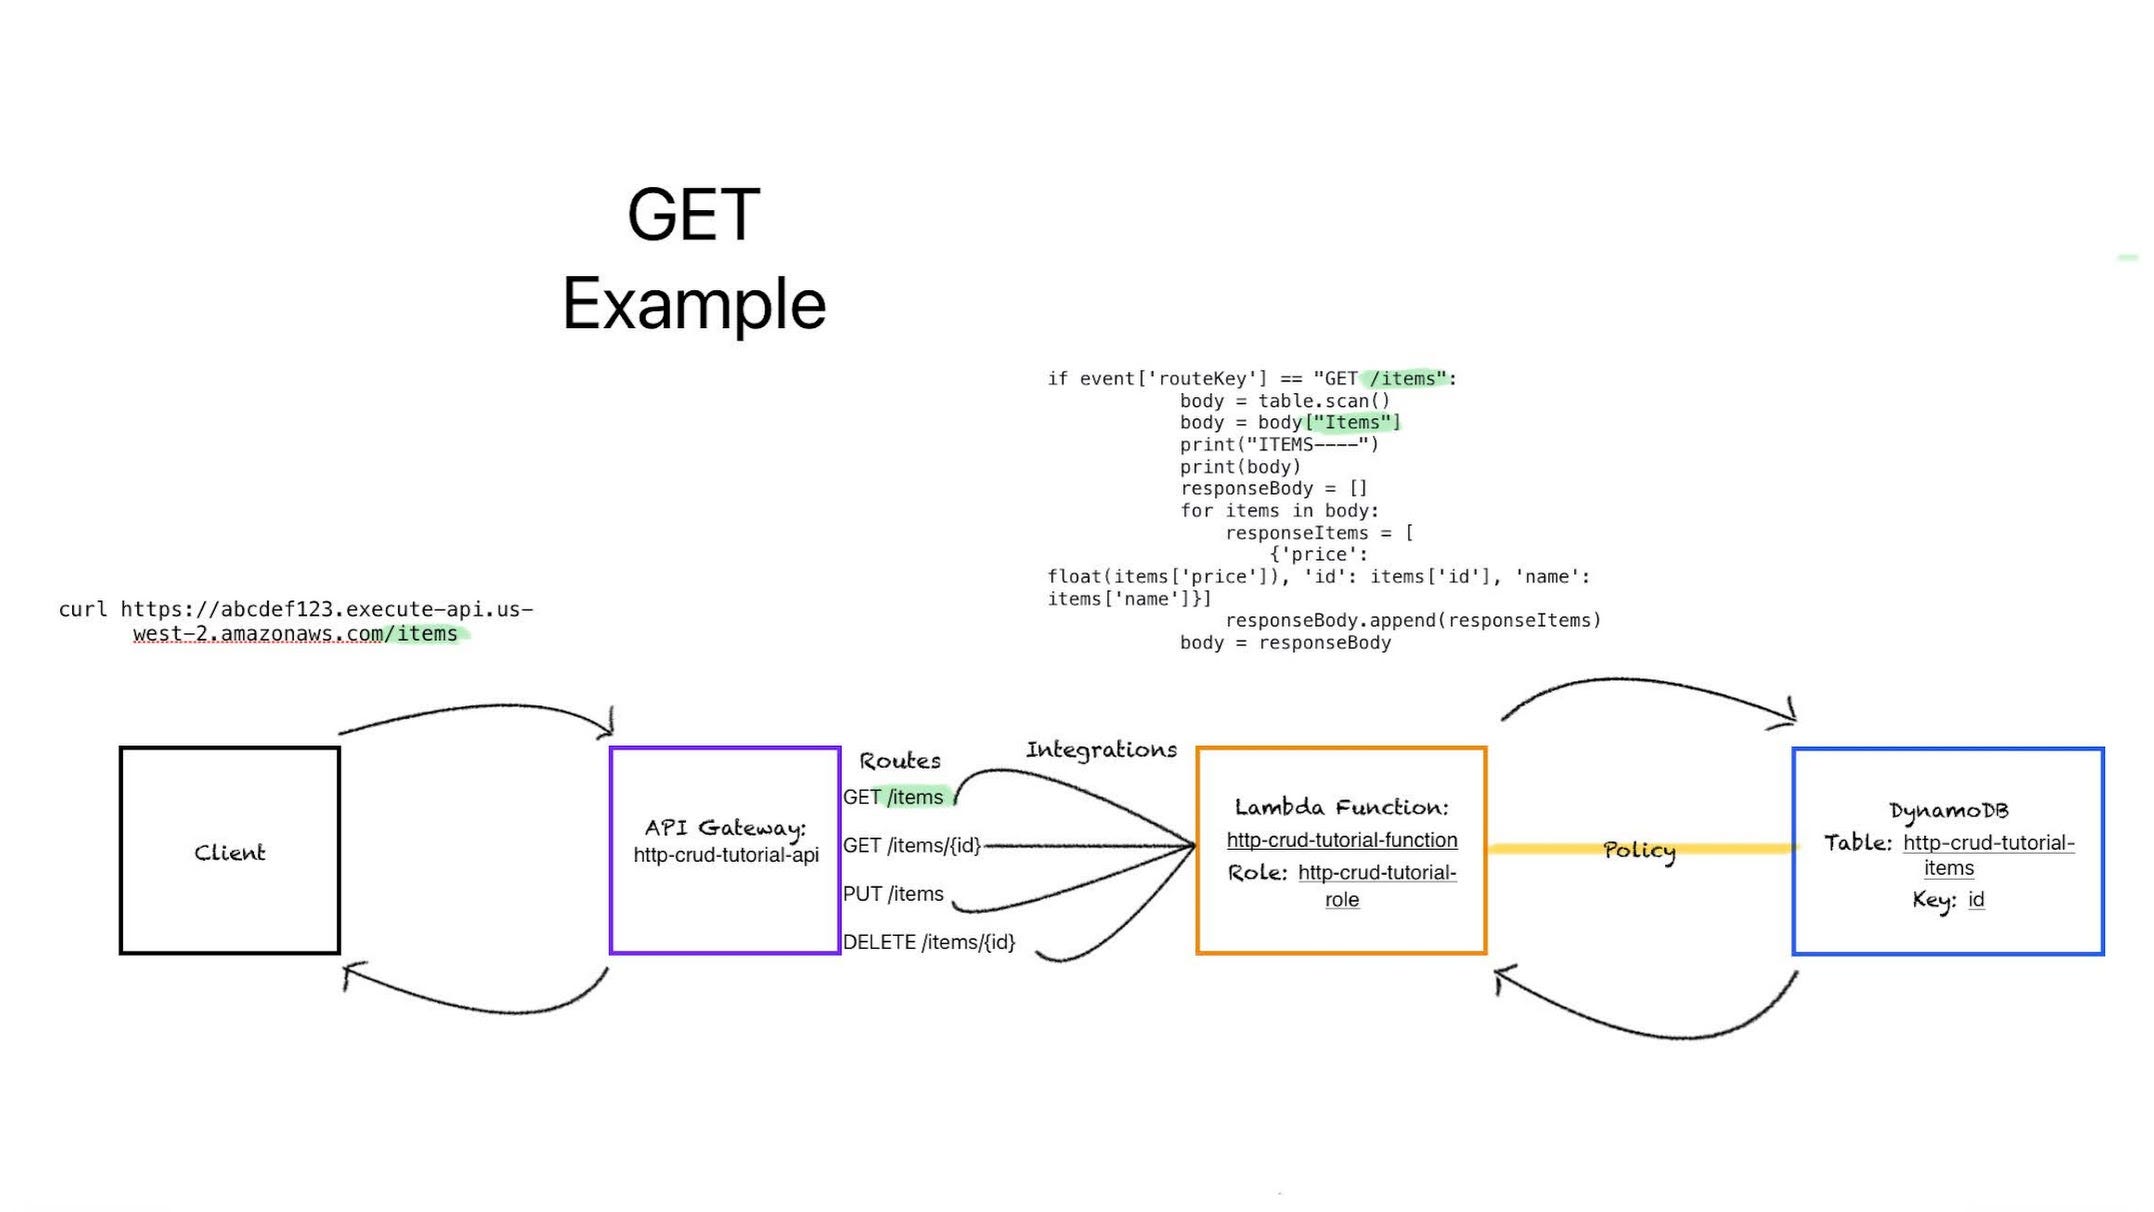
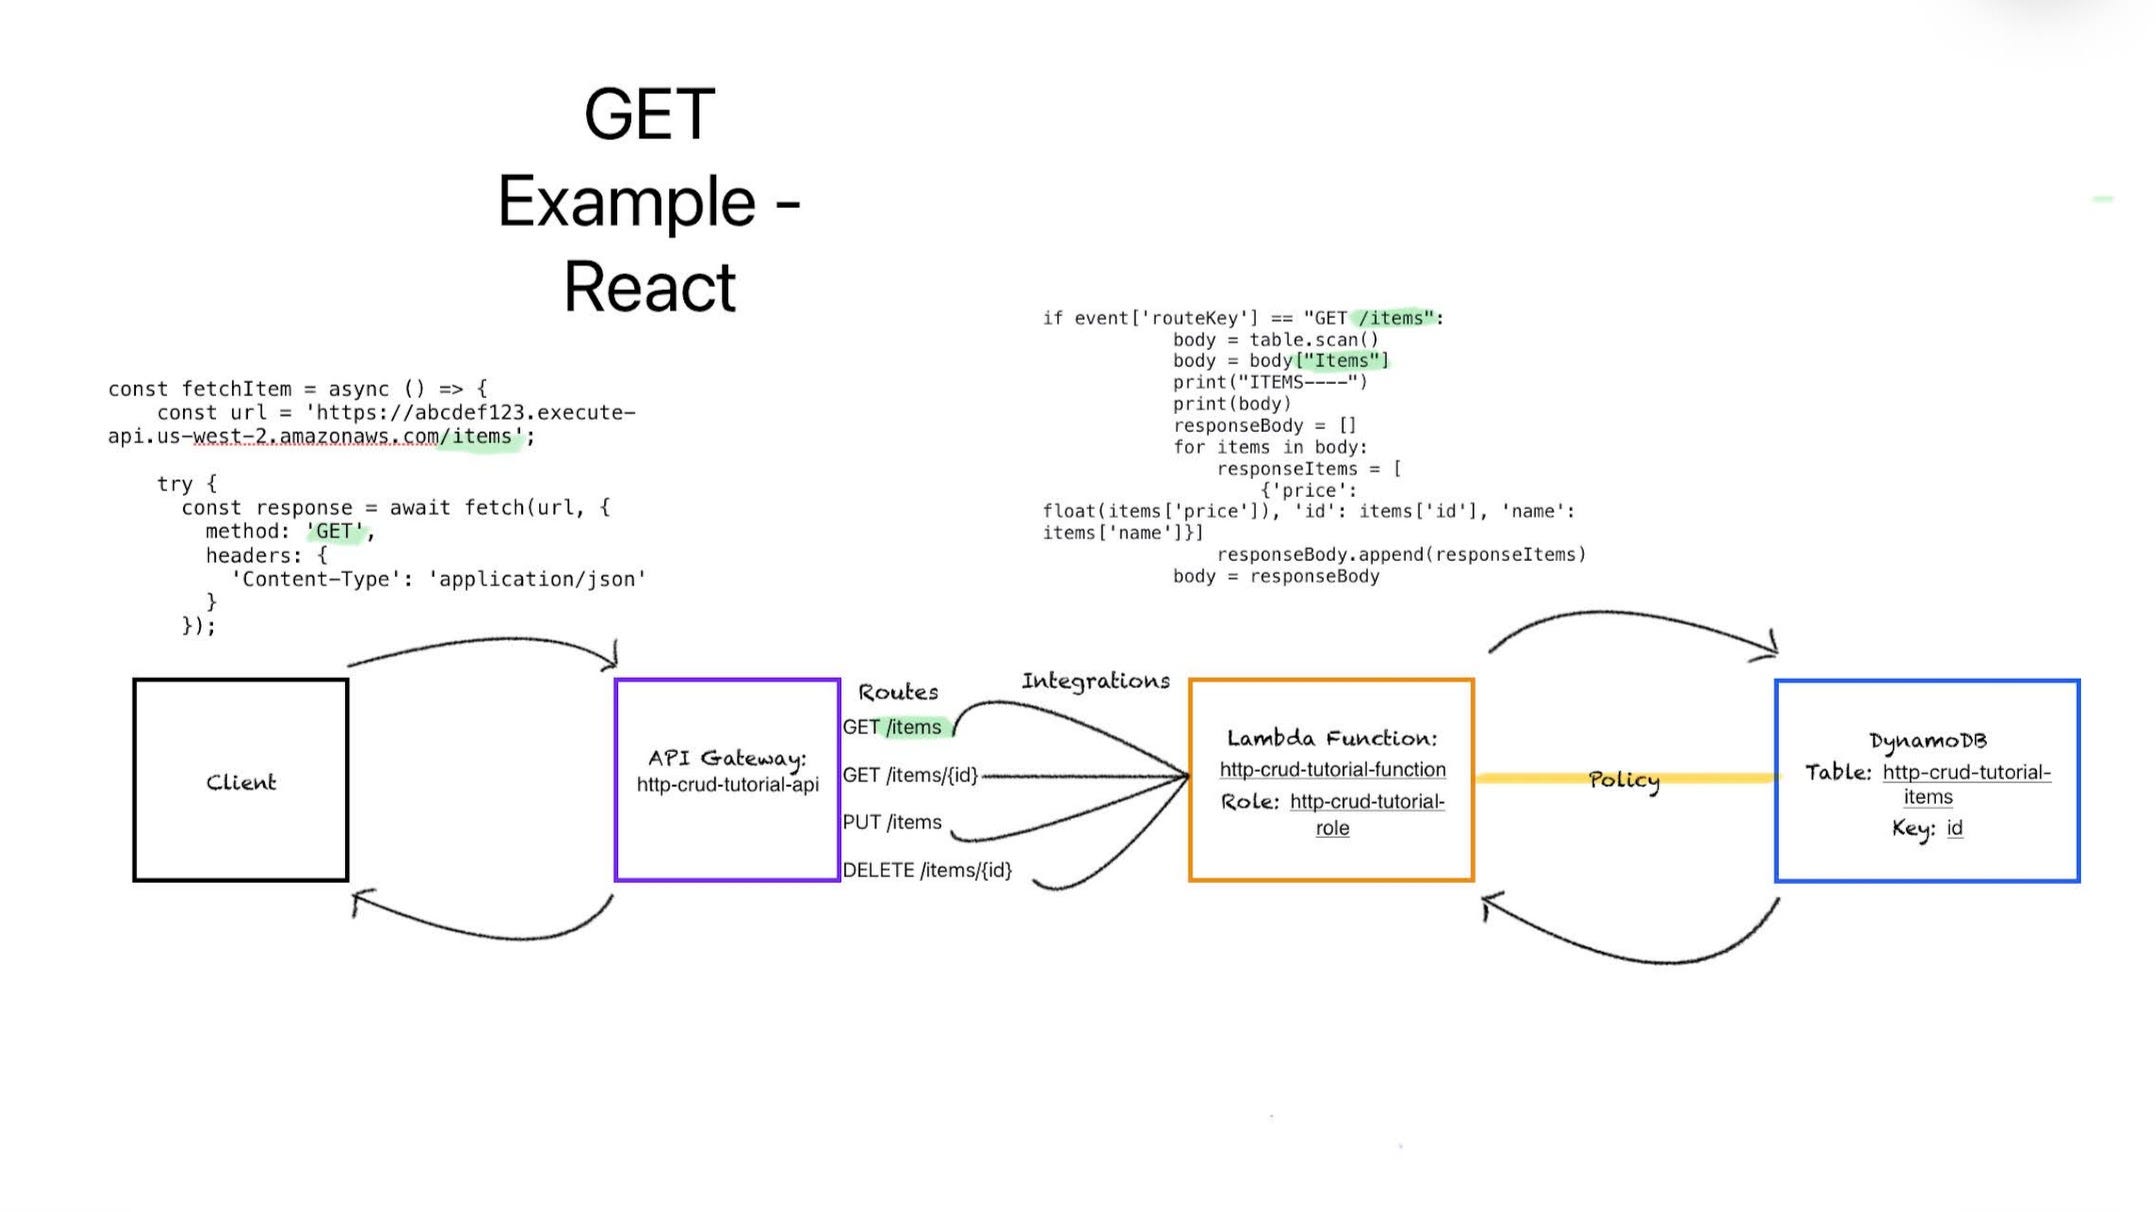
Below is a GET example. We have a simple cURL calling the API Gateway URL - with the /items route tagged on at the end. That triggers the GET /items route call, which is then put into the Lambda event handler. This is not the entirety of the the Lambda function, but only the case statement for handling the GET /items route. It scans the database table, grabs all the items, and then returns them to the gateway as a JSON object.
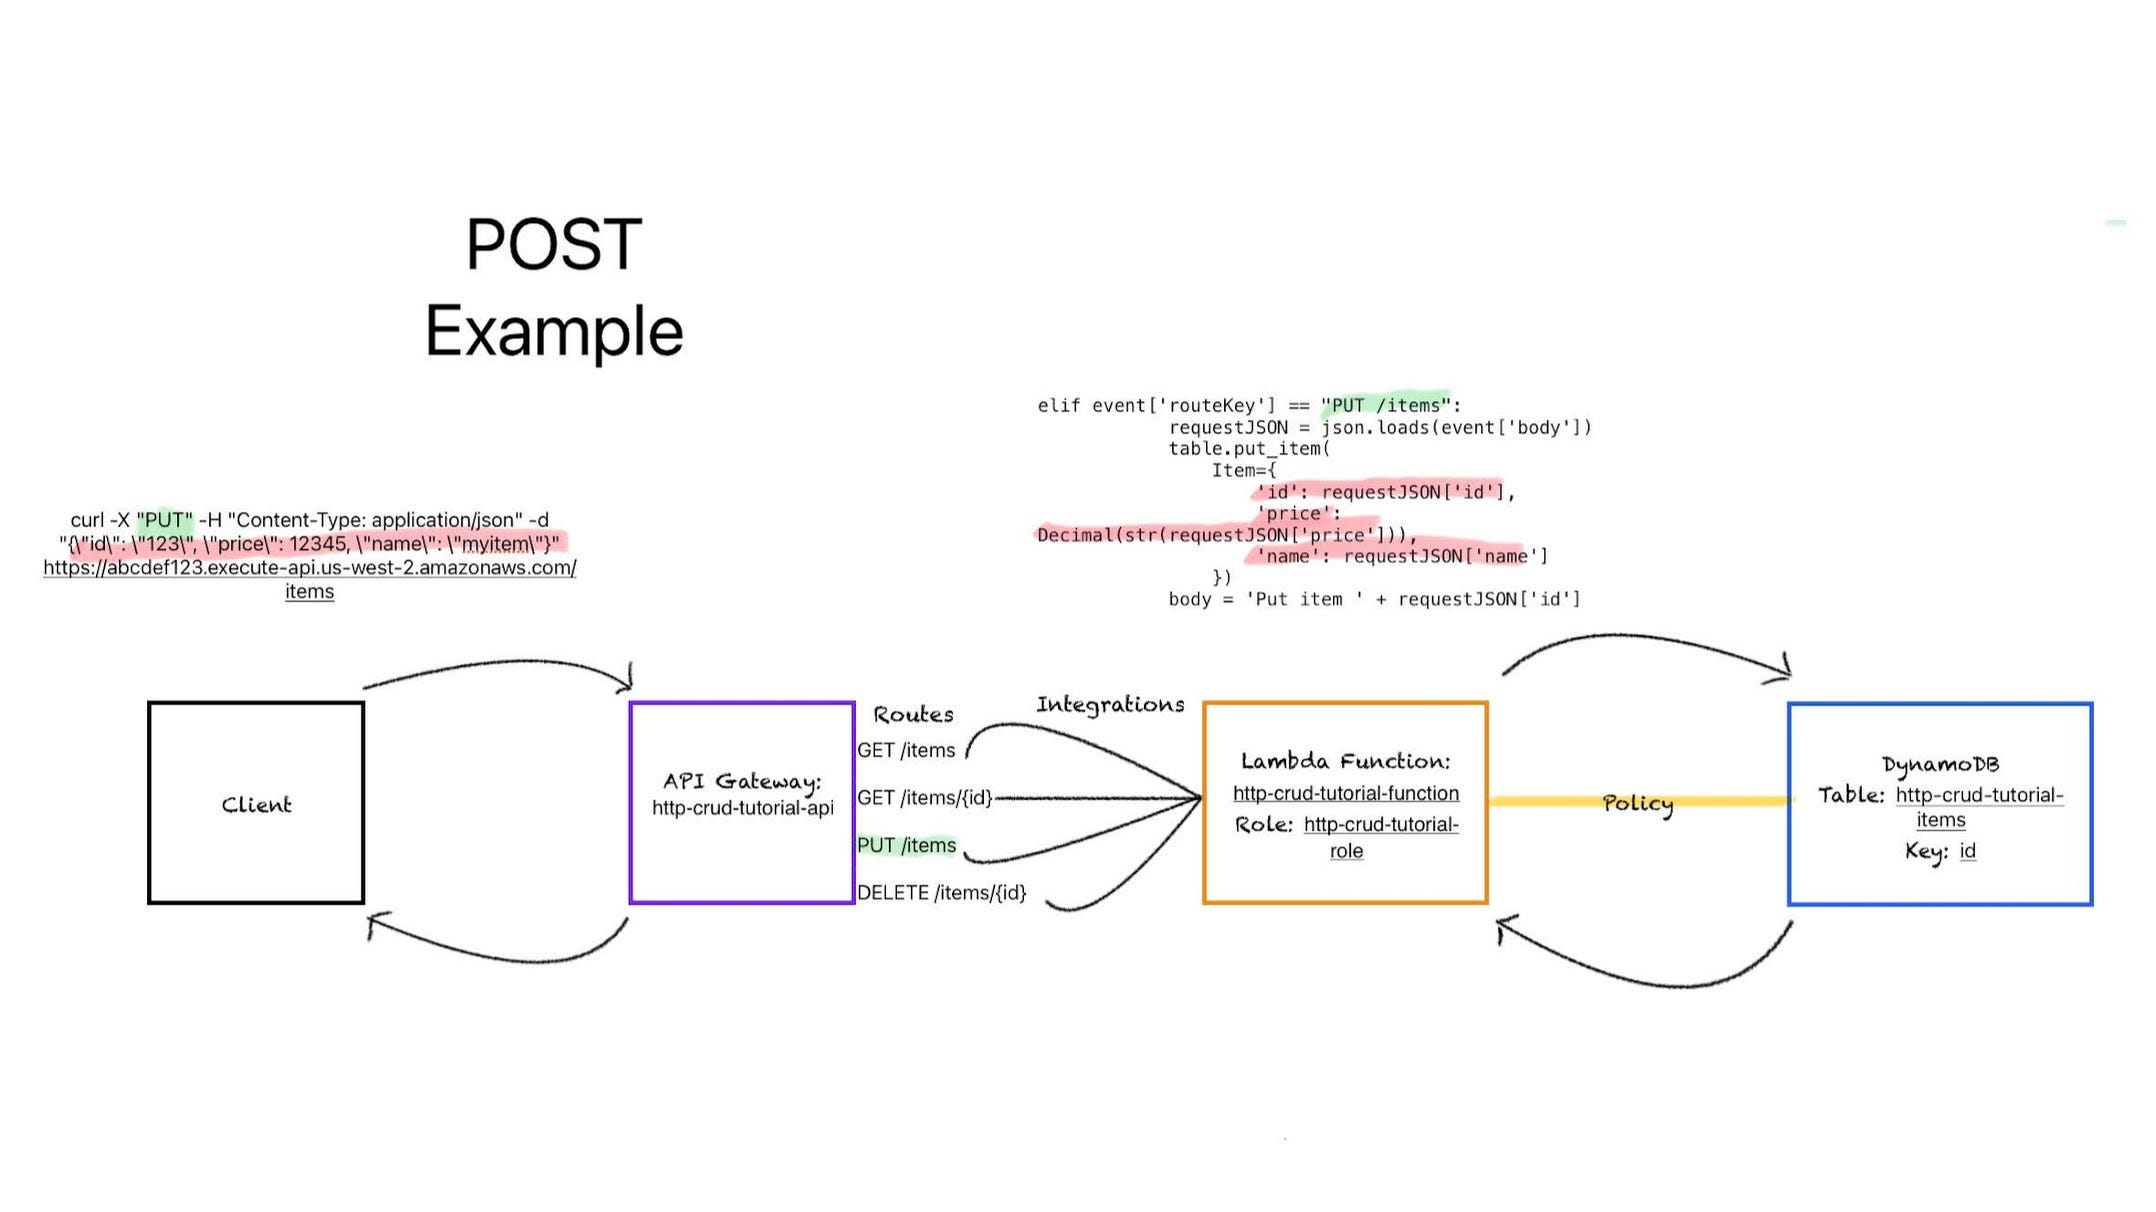
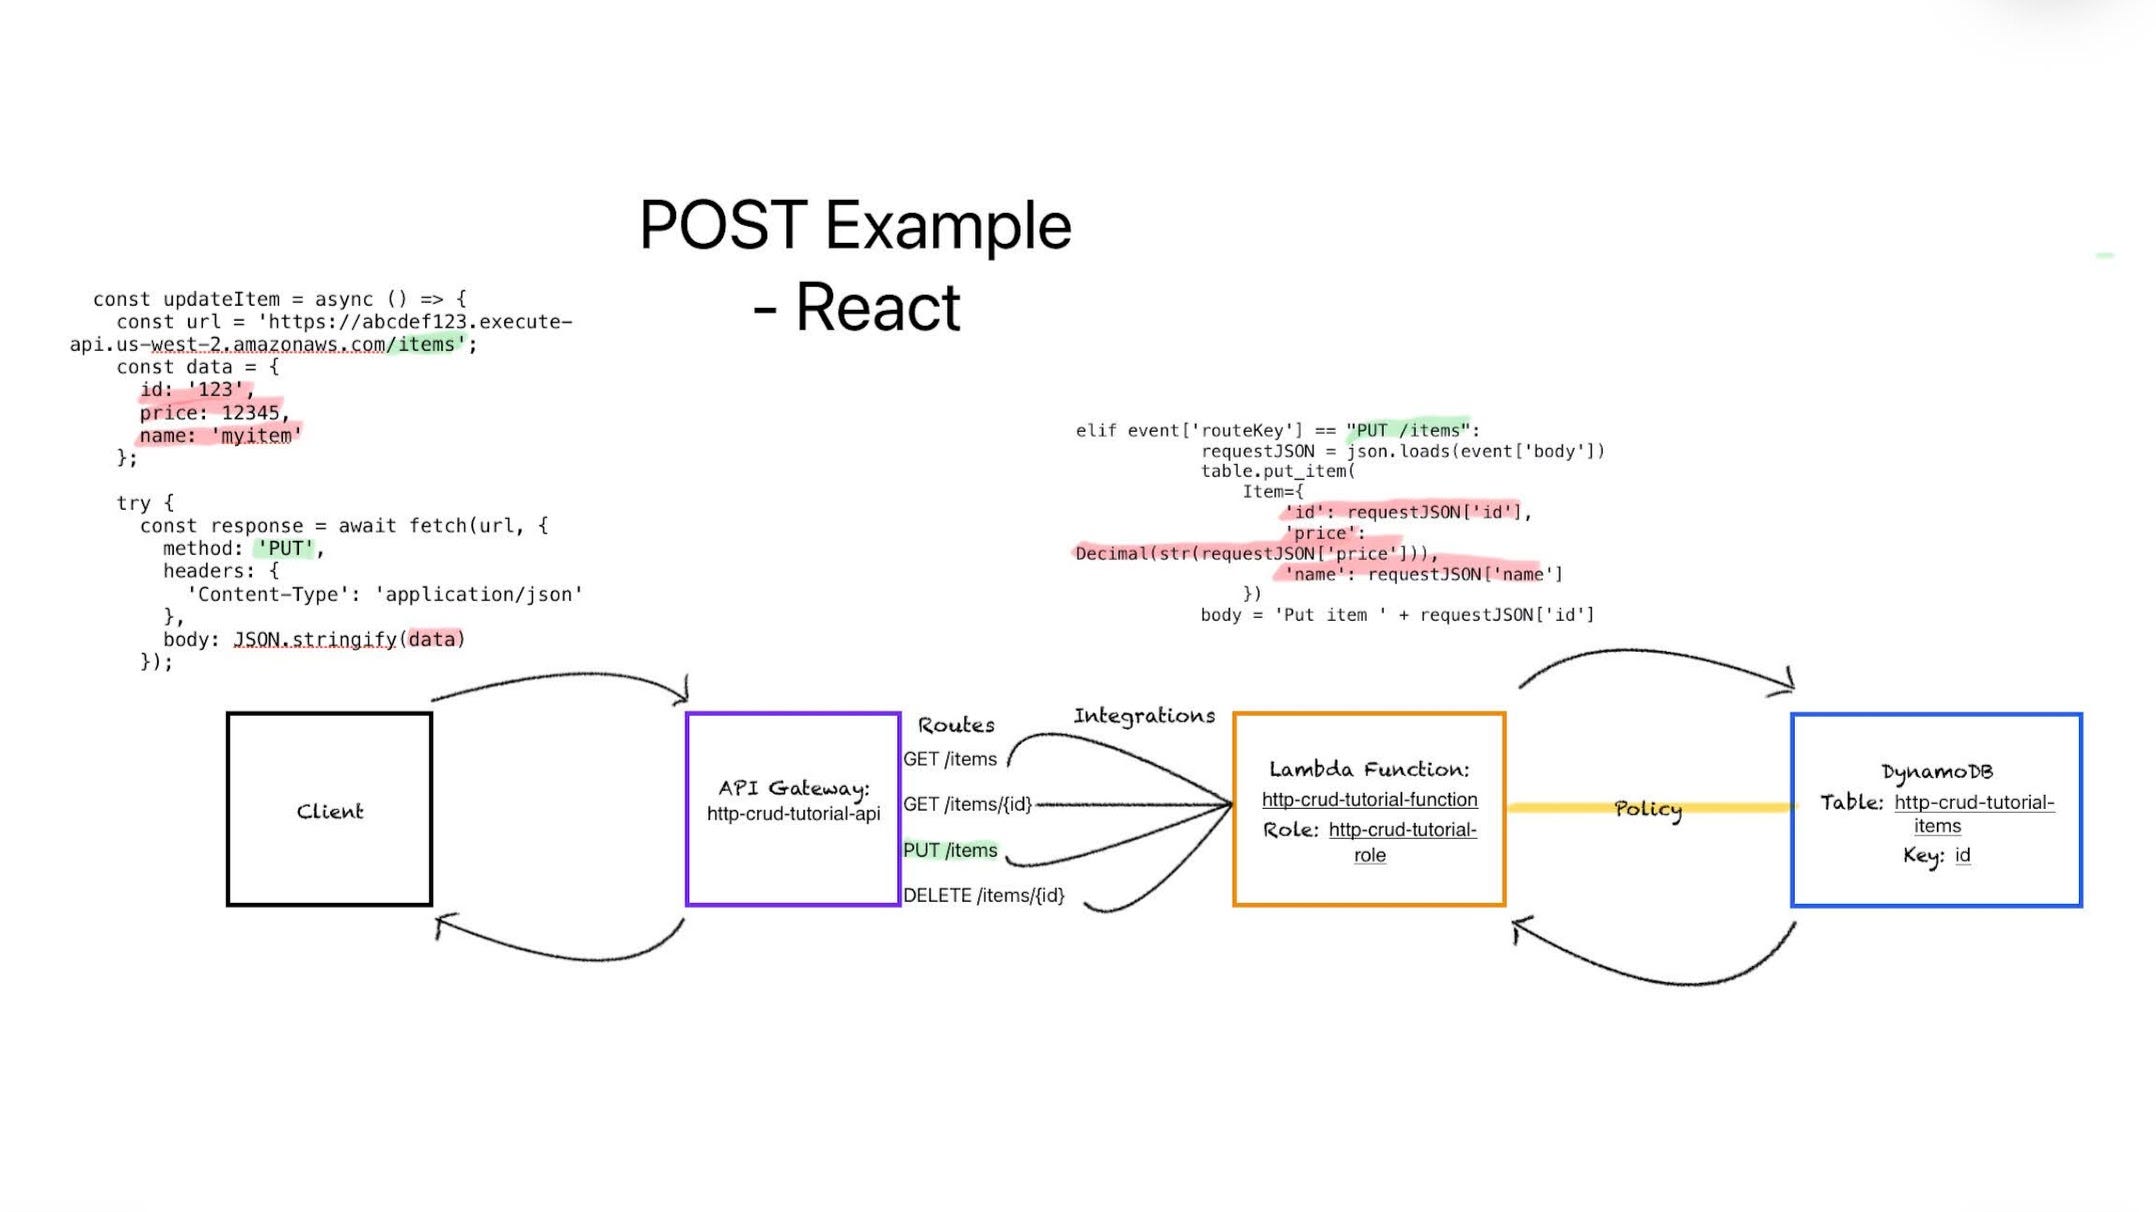
Here is the equivalent for a POST example. This time, in my cURL call I include a JSON object containing the values for id, price, and name. That triggers the PUT /items route which then has the Lambda function insert the new item into the database.
Here are GET and POST examples using the same code - but I modified the cURL command to be a React call - which is my preferred front-end language. Ignore the URL not being an environment variable and the incomplete try-catch block - I have to try to balance the amount of code included.
Putting that all together, we now have four different diagrams with workflow and implementation details.
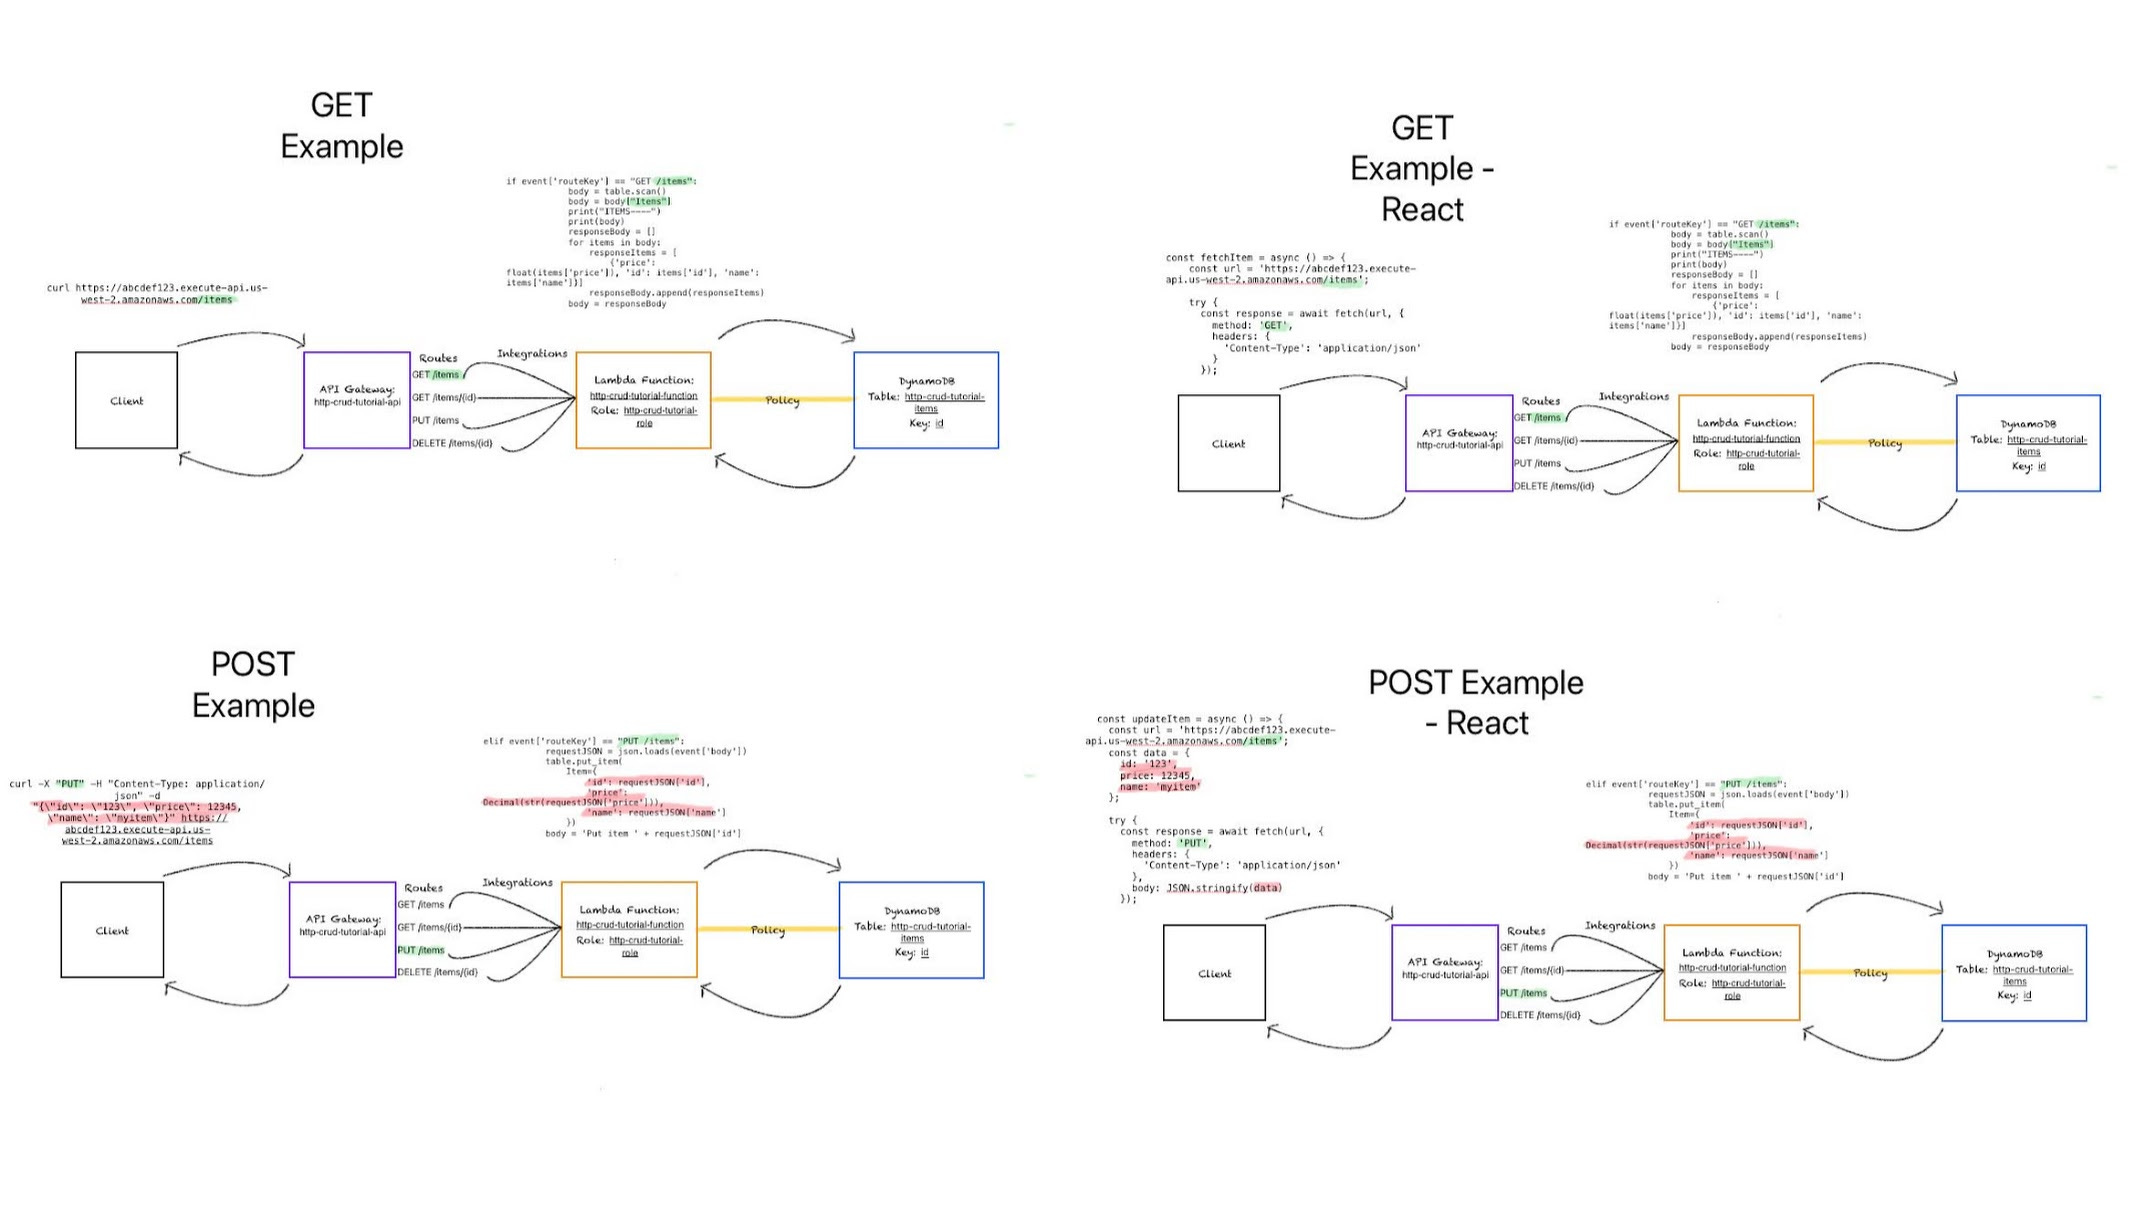
These diagrams deepen my understanding of how my tech stack works. But they aren’t valuable to other people if you don’t have the context of each and every step.
Thank you all and please feel free to reach out with any feedback.